The performance data in EQuIPP® helps your pharmacy understand performance for standardized medication-related quality measures. This claims and eligibility data is based on prescription claims, patient eligibility or enrollment in their health plan, and in some cases, medical claims. Viewing your pharmacy’s performance and trending month-over-month is a great start. But there’s other context in EQuIPP® that provides insight to industry wide performance trends. Today’s article focuses on understanding those benchmarks or thresholds and what they mean to your pharmacy.
CMS Star Ratings Thresholds
Everyone is already familiar with the CMS Star Ratings Program and their 5 Star Rating program for health plans. There are performance scores, or thresholds, associated to each Star Rating. These are updated each year, typically around October. When updated in October, the thresholds will be based on performance scores for health plans from the PRIOR calendar year. In addition, Star Rating Thresholds are based on the beneficiary enrollment period for Medicare, which is the calendar year (January 1 – December 31). Therefore, if your pharmacy wants to be a high-performing pharmacy, the right way to view your performance vs the CMS Star Ratings Thresholds is to compare your Year-to-Date (YTD) measurement period in EQuIPP®. This ensures you are comparing “apples to apples” with the data.
Top 20% Medicare 6 – Month
Top 20% Medicare – YTD
The “Top 20%” thresholds that you see in EQuIPP® are unique performance thresholds that you won’t see anywhere else. These thresholds are updated monthly when EQuIPP® is refreshed with new performance data. The Top 20% Medicare threshold is based on ALL Medicare data that is available in EQuIPP® monthly. It is determined by pulling together all pharmacies that have 10 or more patients for that measure, in the measurement period.
The thresholds for 6-Month and YTD should expected to be slightly different for most measurement periods. The 6-Month measurement period and thus, the “Top 20% Medicare 6 – Month” threshold are based on a 6-month period. On the other hand, the “Top 20% Medicare – YTD” threshold will be based on the calendar year, starting with January 1 and ending with the most recent month for which data is available. What does this mean? If you are looking at the “Top 20% Medicare – YTD” threshold it will typically decline over the course of the calendar year, while the “Top 20% 6 – Month” will be relatively consistent each month. As noted above with the CMS Star Ratings Thresholds, the PQS team would recommend prioritizing the YTD performance and thresholds.
Organization Average
State Average
All EQuIPP® Average
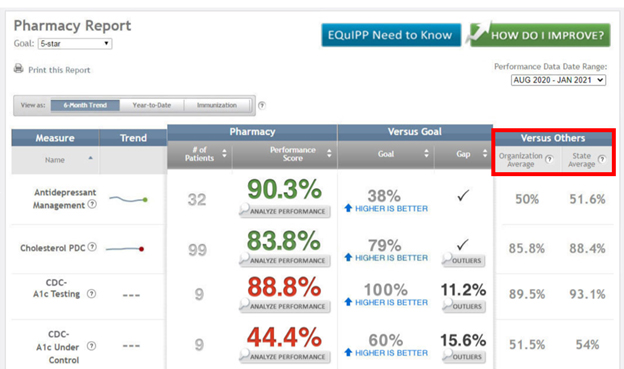
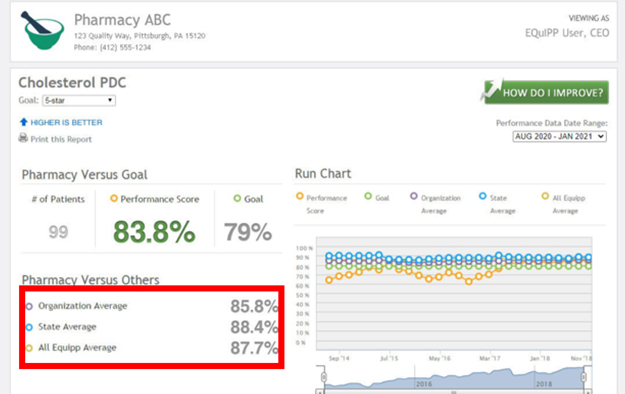
The final group of thresholds are all related to various thresholds that identify the “average” performance for a group of pharmacies, based on the available data for that month’s EQuIPP® refresh. These respective scores are based on ALL data from the data providers that are used in measure calculation. Each benchmark or average performance score provides a good indicator for your pharmacy vs. other pharmacies that have attributed performance data in EQuIPP®.
The “Organization Average” is the performance score for your “parent organization”. Typically, for independent pharmacies this will be the score for your Pharmacy Services Administrative Organization (PSAO) or other group that provides EQuIPP® access for your pharmacy.
The “State Average” is the performance score, based on all data for the state in which your pharmacy is located.
Finally, the “All EQuIPP® Average” is the performance scored, based on ALL data in EQuIPP®.
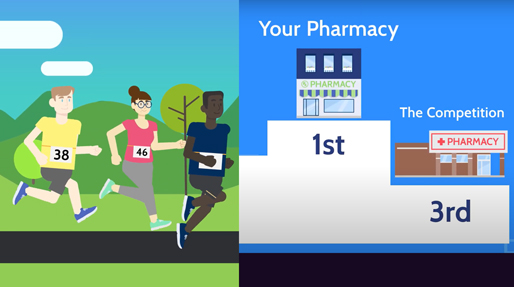
In each of these situations, you want your pharmacy location to be above the EQuIPP® average. An even better indicator for your pharmacy is if you can reach or exceed those Top 20% thresholds that were mentioned above.
Final Notes
Understanding how your pharmacy performs when compared to some of these thresholds is a good place to start. If your pharmacy is high performing based on these thresholds, be sure to celebrate and recognize your staff for their great work! If your pharmacy is performing below some of these key thresholds, review this information with your team members and create a new action plan, with goals to reach by end of the year.
If you would like to understand more about how performance scores are calculated or how benchmarks are determined, I recommend viewing the following videos:
- How Patients Qualify for Measures
- How Goals and Benchmarks are Determined
- Measurement Periods and How Performance Changes Over Time
If your pharmacy needs to confirm how to access EQuIPP®, or if you have any questions about the data for your pharmacy, contact us directly. Email support@equipp.org or click on the EQuIPP® Support Link at the bottom corner of your EQuIPP® dashboard.